Chartea
At work I spend some of my time looking at liquidity on crypto markets. To streamline this I’ve written a couple of internal command line tools for fetching and analysing different liquidity metrics. I was looking for a way to visualise depth charts in the terminal, and at the same time was quite interested in learning how to use Bubble Tea a bit more effectively, so ended up creating Chartea, an order book terminal visualisation.
The visualisation is pretty straightforward. It uses a struct with two slices Bids and Asks. Each slice is made up of orders, each one of which has a Price and a Volume. The model takes care of sorting the bids and asks depending on whether you are viewing the bids and asks side by side, or stacked on top of one another.
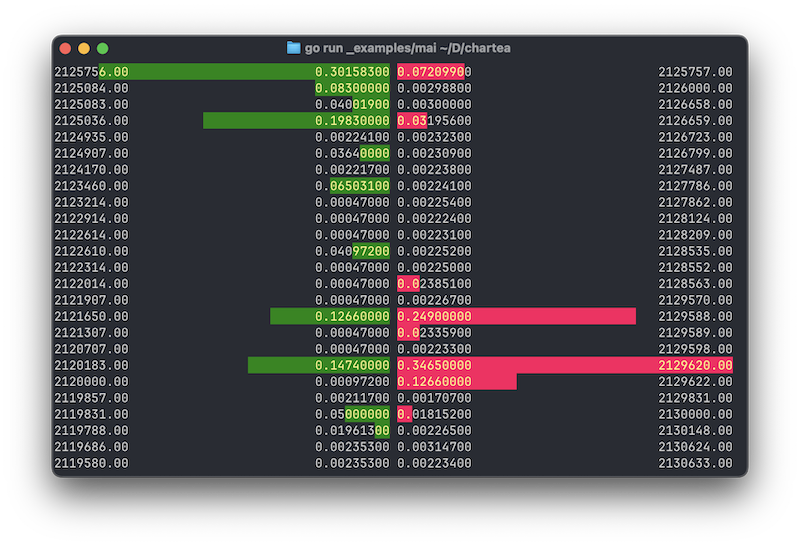
When viewing side by side, the best bid and best ask are at the top - bids on the left and asks on the right. Bids are sorted from highest price to lowest price, asks are sorted from lowest price to highest price. The best bid is the most you can sell for, best ask is the lowest price you can buy for.
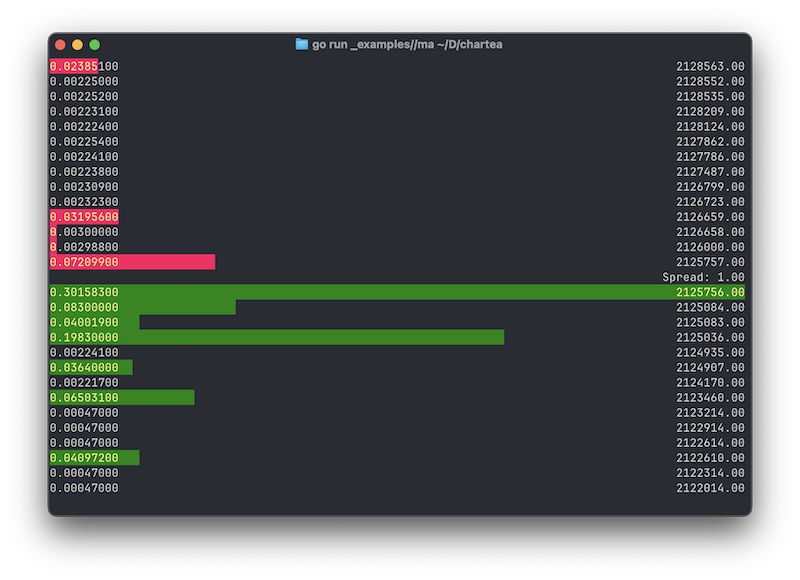
When viewing vertically, asks are stacked on top of bids, and both are sorted from highest to lowest. The difference between the lowest ask and the highest bid are therefore above one another, and the difference between the two is the spread. When viewing the order book in this way the spread is shown between best bid and best ask.
The volume of each of the individual orders is shown relative to the total visible order volume in that side of the book - the number of orders shown is limited by the height of your terminal, and so the proportion is based on what you can see, rather than the entire order book.
When viewing the order book stacked vertically, you can also choose the alignment - on which side the bar and the volume is shown.
It still needs a lot of testing, and the example in the repo is very much a WIP, but it was a valuable learning experience digging into Lip Gloss.